We’ve recently been learning more about the energy usage through our home in Melbourne, Australia. We’re still on the first lap around the sun with this house, so each month brings a new experience of how it behaves.
As Lars says, houses in Australia are made from chicken wire and cardboard. They’re notoriously inefficient to heat or cool. The previous owners did a major renovation but chose to follow the trend rather than doing anything about it.
Whilst we chip away at draught sealing, and slower projects like insulation and window improvements, we wanted to at least optimise how we were using energy, and in particular, electricity.
Smart Meters – What We Have
All houses in Victoria have a smart meter, which constantly reports back intra-day usage data. This is then user-accessible via the chosen retailer.
It’s kind of interesting, because you don’t get a bill surprise six-weeks after you used the energy, but it’s not very granular. Reporting is in 30-minute blocks and delayed. This means you’re stuck looking at very high-level trends. It makes sense considering the volume of meter data that needs to get pushed around and aggregated between all the mesh-connected smart meters, but it’s not a great user experience.
We currently use Powershop, who expose both data export and a few visualisations, like this heatmap:

Smart Meters – What We Could Have
The smart meters deployed in Victoria also support local Zigbee connectivity.
That’s the same underlying protocol that other smart devices like Phillips Hue already use, which would make it excellent for surfacing local, real-time energy information directly into a home automation platform.
One intended use of the Zigbee capability is to support the connection of an in-home display, so that you can have something like this Rainforest EMU-2 sitting in a visible area of the home:

There’s a write-up about this category of displays on the Australian Government’s YourHome website – “Australia’s Guide to Environmentally Sustainable Homes”, developed by the Department of Climate Change, Energy, the Environment and Water.
Their connected home page says:
In-home displays (IHDs) are devices that give a visual indication of how much energy the home is using and what it is costing at any given time, using data transmitted from a smart meter or submeter. Most of us never go near our electricity meters, so we cannot easily see how quickly the registers or the numbers on the display are changing. Even if you could, it would still be difficult to work out how much electricity you are using, how much it is costing, and whether it is more or less than it was an hour, a week, or a year ago. If your home is on a time-of-use tariff, the display will help you to know exactly when one price period ends and the next one starts, which can be hard to remember.
IHDs can bring all this information inside your home, or onto your computer and smart phone, in a form that is easy to understand. The simplest IHDs indicate with coloured lights or symbols, whether you are in a high, medium or low price period, to help you decide whether to run high-load appliances such as vacuum cleaners. An IHD of this type needs to know only the clock time and time-of-use tariff schedule, which can be pre-programmed.
https://www.yourhome.gov.au/energy/connected-home
Sounds great! Direct, digital integration.
I don’t want a separate screen; I just want to get the data flowing into my home automation platform. There is a well-defined specification for the “ZigBee Smart Energy Profile 1.1”, and we already have a Zigbee ecosystem in the house.
The first thing I found was that the pairing process was the inverse of what I expected. I thought I would take our existing Zigbee coordinator, put it into pairing mode, and then somehow tell the smart meter to join. What I discovered was that the smart meter acts as a coordinator, and everything else gets added as a client. In retrospect, this does make some good sense: it means that people just need to add an in-home display, and not a separate hub in the middle.
The next thing I discovered is that the smart meter’s coordinator is centrally controlled. There’s no way to directly trigger a pairing process on it. This seems to be the global standard in how these devices work.
Specifically, it’s done via the energy distributor. For us, that’s Citipower/Powercor, who provide distribution for ~1.2 million Victorian homes.
Regardless of which retailer you’re using, you can establish an account directly on their myEnergy portal. (If you’re on a different Victorian distribution network, here’s a handy list of equivalent portals.)
Buried several menus deeps, only accessible from some pages but not others, and proudly sporting a “© 2018” statement, you can eventually find a page to Manage my HAN Devices. This page states:
A Home Area Network (HAN) device, such as an In-home display, can be used to wirelessly access near real-time and historical electricity consumption information directly from your meter (interval ‘smart meter’). myEnergy provides you access to your meter to authorise the connection of one or more HAN devices. Please have your device MAC address and Installation code details ready and select ‘Connect HAN device’ to begin the process.
The connection form prompts for:
- NMI (National Meter Identifier)
- Meter serial number
- Device – one of:
- Percepsion IHD
- Chameleon IHD
- Pipit 500 IHD
- Intercel eKo IHD
- Planet Innovation USB dongle
- Rainforest Eagle Gateway
- Other In-Home Display
- Other Load Control Device
- Other Load Smart Thermostat
- Other Range Extender
- Other Smart Appliance
- MAC address
- Installation code – 16-digit hexadecimal
- Nickname
For me, the most compelling device in this list is the Rainforest Eagle Gateway. It can act as bridge between the smart meter’s Zigbee network, and a local ethernet environment.
Whilst being a primarily US-facing company, their US store will ship to Australia, and they have a page specifically listing compatibility with Victorian distributors. Right now they’re out of stock, with a “sign up to be notified” option, and they’re US$99 (~AU$145).
This type of integration seems compelling, but the devices are an expensive step. They aren’t actively promoted in Australia, so I wonder how well the distributor would support them if I was to track down some stock.
The whole Home Area Network / In-home Display ecosystem looks like a massively underutilised capability of the smart meter network, that’s just sitting dormant right now.
I parked this route while I explored a more locally advertised solution first.
Powerpal
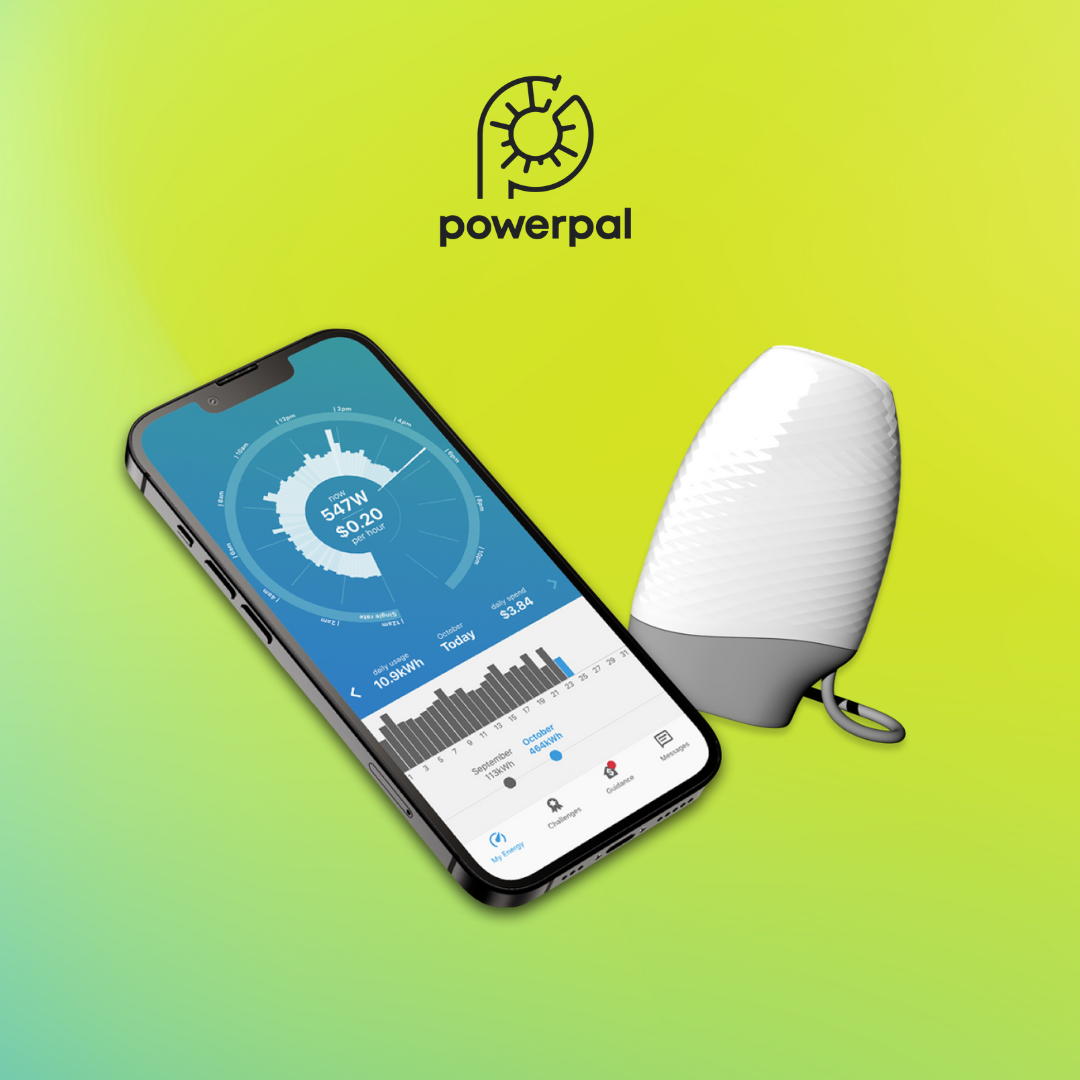
Powerpal devices aim to solve the in-home display challenge, without the distributor lockdown and pairing hurdles. Their tag line is “See, optimise and control your power usage in real-time.”
It’s a small device that connects directly to the meter, and then exposes real-time usage information over Bluetooth LE to a corresponding mobile app.
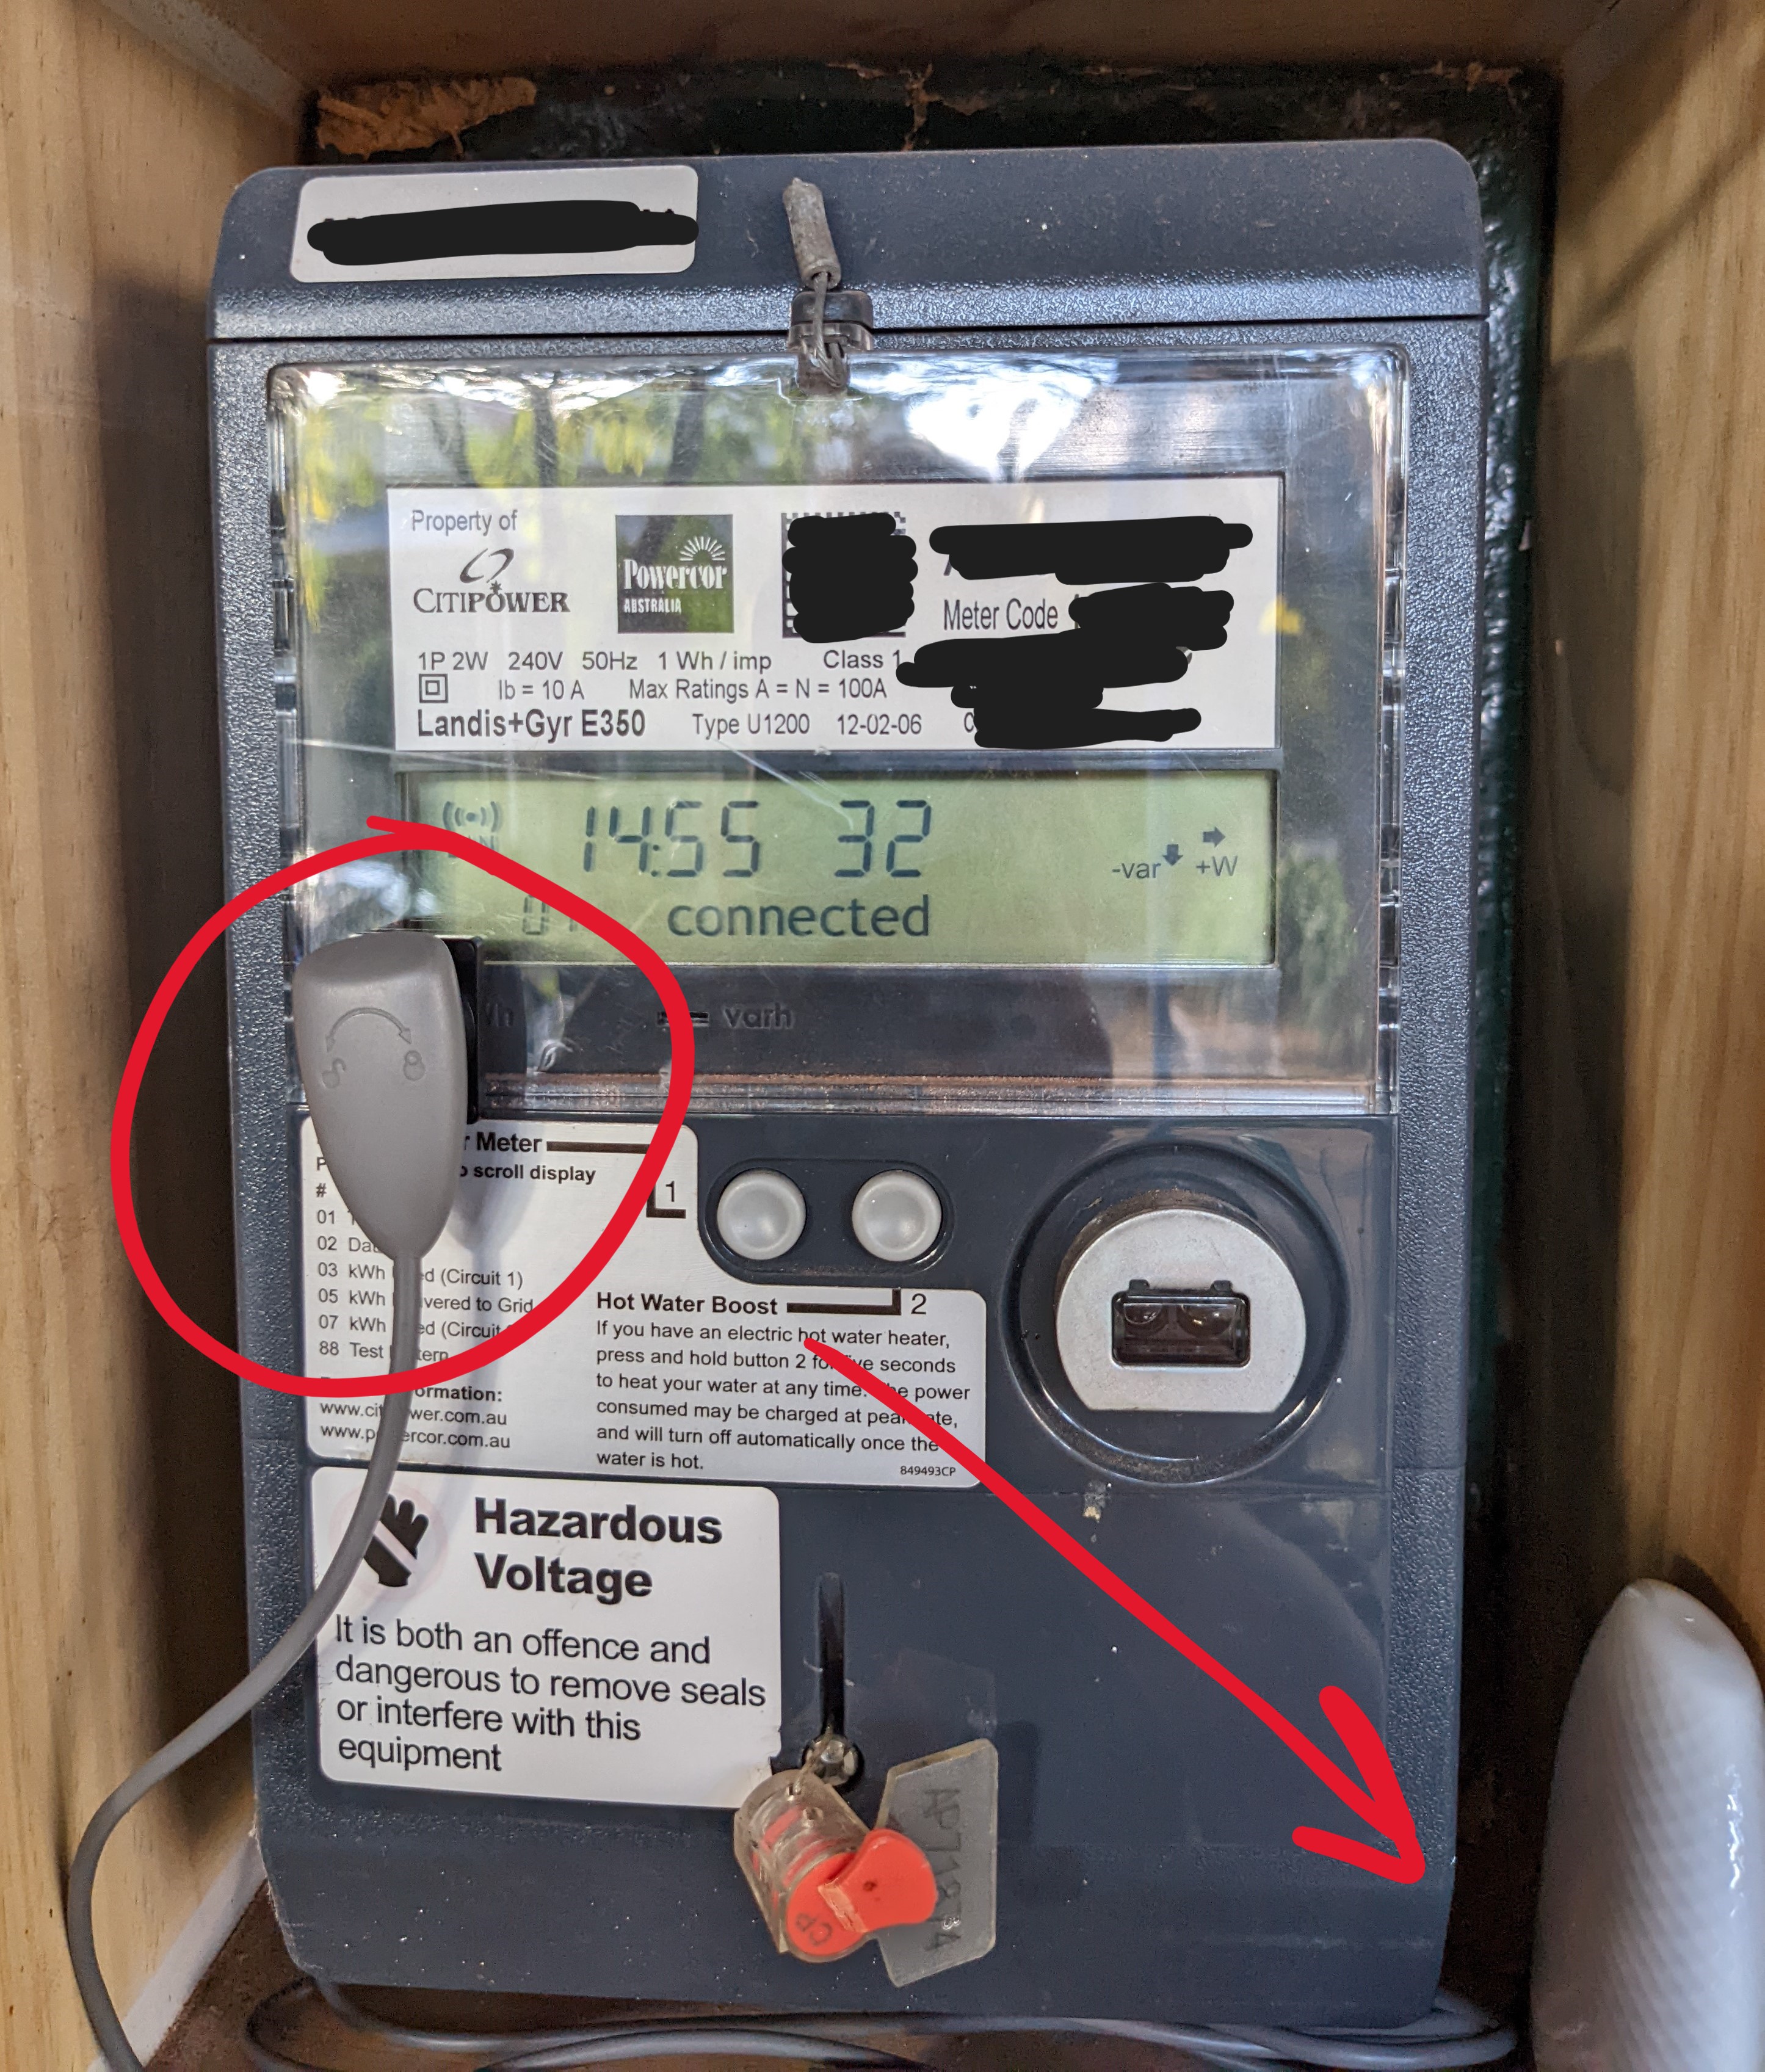
The physical integration is so incredibly simple: the meter has a red LED that blinks on a defined interval, and they just stick a sensor on top of it which counts the blinks. For our meter, it’s one blink per watt-hour (Wh) of energy. (It says “1 Wh / imp” on the front of the meter.)
The device itself is battery powered, as paradoxically the one place that you usually don’t have an easy wired power source is at your meter. Thanks to the magic of Bluetooth LE, it has an expected lifespan of 3-5 years.
The whole thing fits inside our existing meter housing (* once I took the drill to the inside of the door to route out just a little more depth for the sensor):

Whilst they retail for $129, they’re entirely free in Victoria thanks to the state government’s home energy upgrades scheme.
It’s a managed install, as they need to demonstrate that it’s working to claim the government rebate. I signed up on their website at 7am on a Tuesday, had the installer turn up at noon on Thursday, and it was all done in under 10 minutes.
With the first real-time insights (~10 second interval) into our usage, it was then incredibly easy to just walk around the house turning specific appliances on and off and seeing their specific draw. It wasn’t practical to do this type of isolation with the previous 30-minute reporting window.
This kept us entertained for a while, but we also had to learn to stop looking at it. It’s very real-time, so it’s easy to get jumpy about things which draw a high amount of power for a short time (OMG THE TOSTER IS ON!!!), or to optimise to a world where you have low energy usage but you’re also just cold.
The insights are good, but the Bluetooth LE connectivity brings several restrictions: you must have your phone in range of the meter, you can only have one phone connected at a time, and it’s not integrated with the rest of our home automation ecosystem so there’s no easy way to correlate historical usage with what else has been happening around the house.
It’s a good-enough solution, and great for mass-market access, but we wanted something more integrated.
Home Assistant Energy
We use the fabulous Home Assistant platform to run all our automation. It’s open source, exceedingly capable, and very actively maintained (top ten project on GitHub). It can be deployed on a Raspberry Pi, or there’s Home Assistant Yellow – first-party hardware that wraps a Raspberry Pi Compute Module with extra smart home radios (Zigbee, OpenThread).
Starting in the 2021.08 release, they’ve built out first-class support for energy monitoring.
We’re still exceptionally early in our adoption of this capability, but we now at least have our grid-consumption and some specific load monitoring integrated:
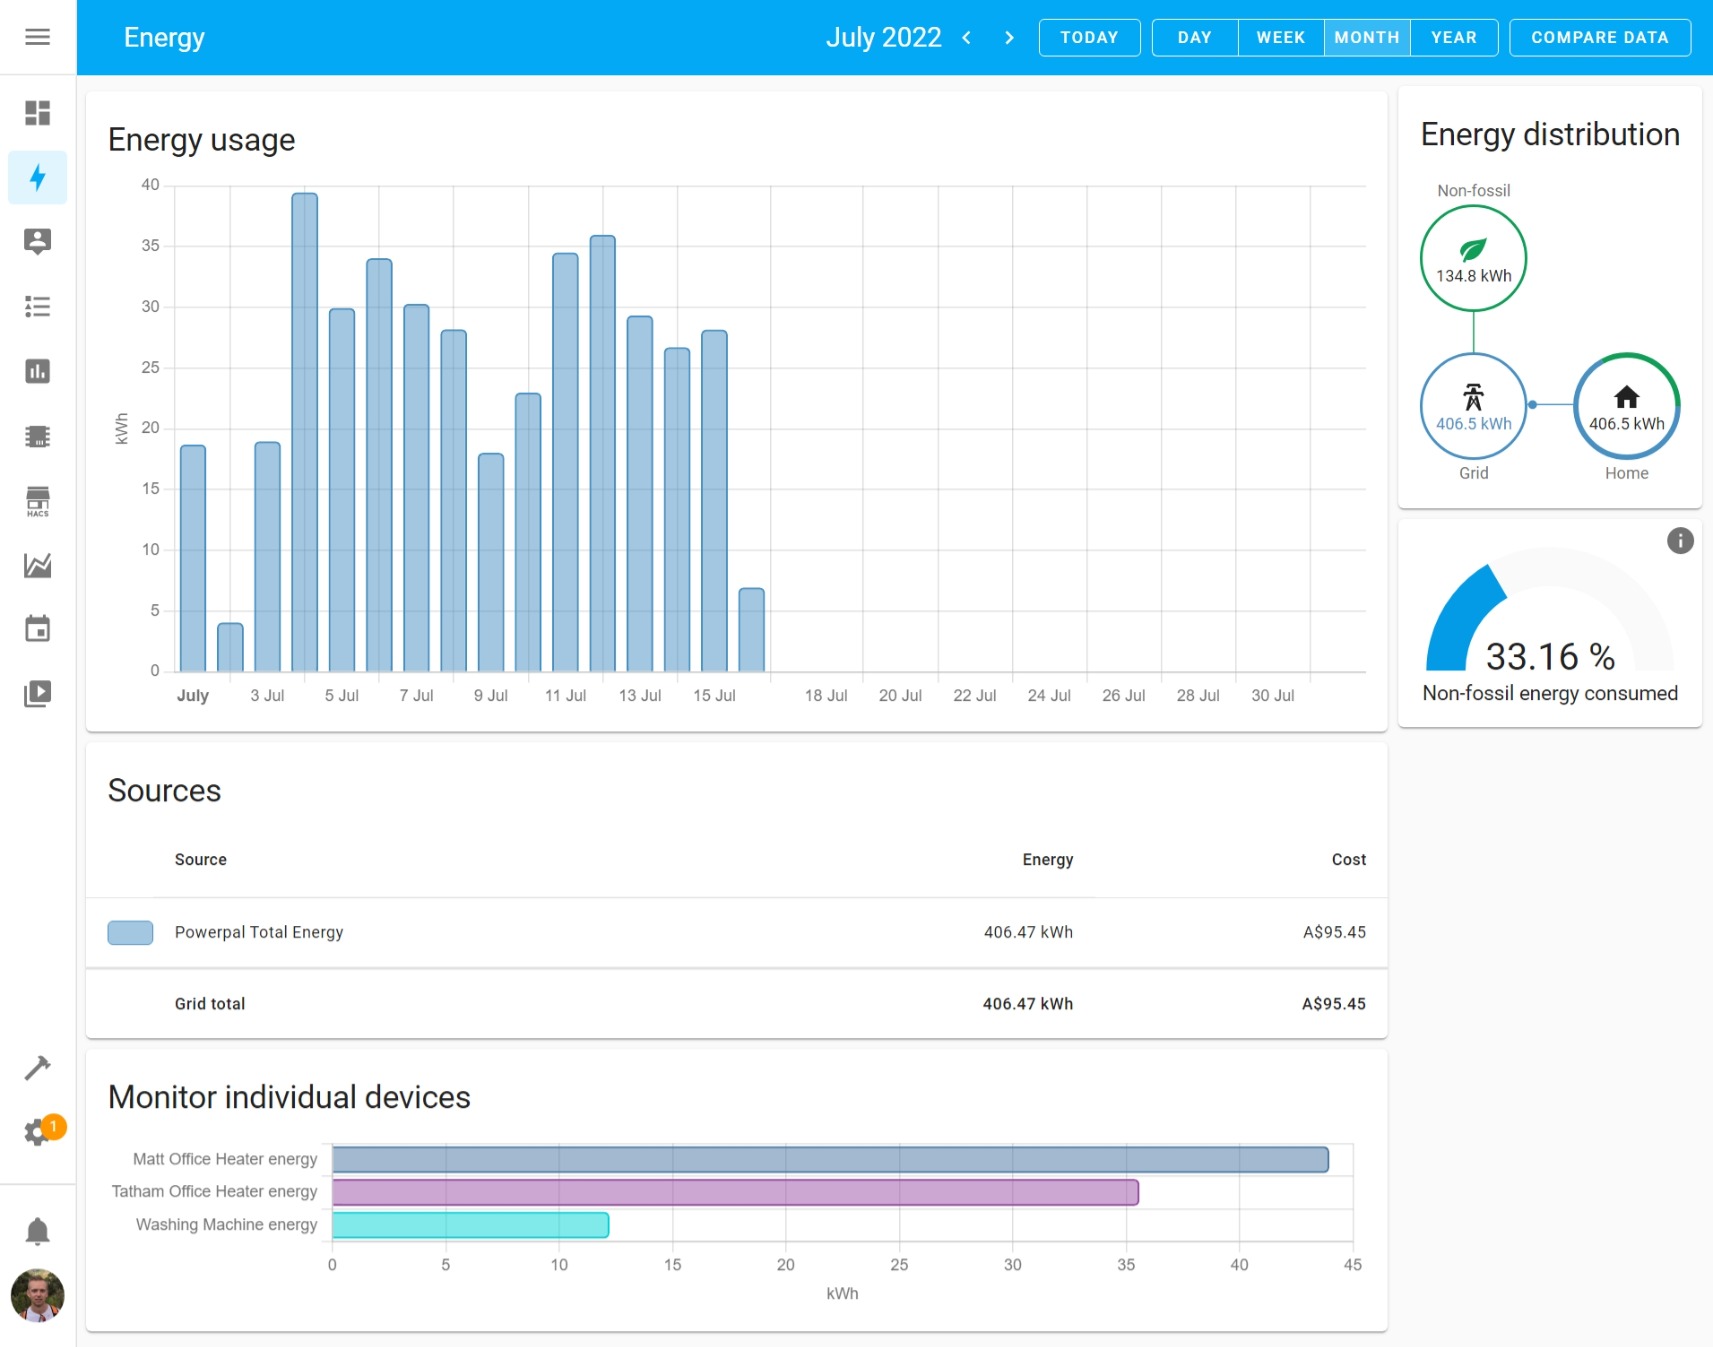
In addition to all of the real-time sensors, data is also aggregated hourly, daily, weekly, and monthly. We can compare periods with prior periods. The dashboard here is just building on standard sensor entities within the Home Assistant ecosystem, so they can all be used to drive automations as well.
The “non-fossil energy” is defined as sources like solar, wind, hydro, and nuclear. Home Assistant sources this information from a service called CO2signal, for our specific part of the grid. Even though we’re paying for 100% renewable energy via Powershop’s GreenPower, we still consume from the same grid as everyone else, so the mix changes throughout the day, and it’s interesting / horrifying to capture that number over time.
The CO2signal data is exposed as sensor.grid_fossil_fuel_percentage (%) and sensor.co2_intensity (gCO2eq/kWh), so they can be individually plotted, and used to drive alerts or automations however we see fit:
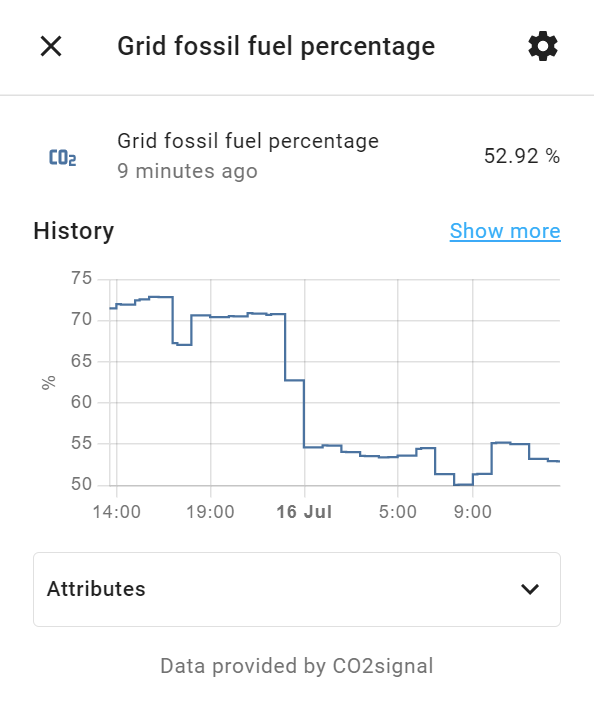
sensor.grid_fossil_fuel_percentageBut where does the grid consumption and individual load data come from?
Load Monitoring
For specific high-power appliances, we’ve added Aeotec Smart Plugs to them. These are Zigbee-based smart plugs with built-in energy monitoring.
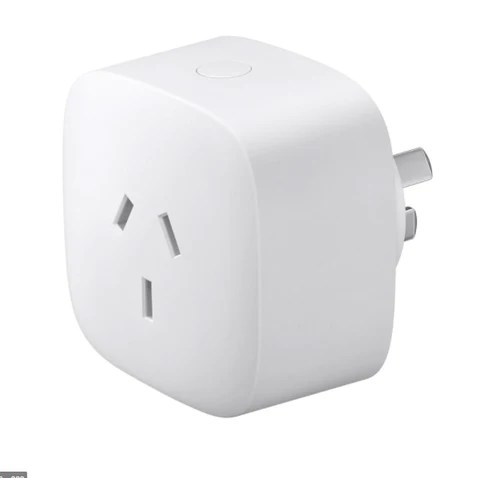
For panel heaters in our offices, we’re able to automate them turning on when we’re working from home and monitor the power (real-time) and energy (cumulative).
By having it all in the same platform as the rest of our home automation, we’re able to mash up this data with other sensors. This view is showing the power consumption of our heaters yesterday, along side temperature data from those same rooms, our front porch, and the nearest Bureau of Meteorology observations at Melbourne Olympic Park:

We can also use this data to detect what appliances are doing, like when the washing machine has finished. We have an automation that triggers when the machine starts using power, then waits until it has used no power for 5 minutes. After that, it sends a push notification to our phones. Here’s the YAML version of that automation, but the same could easily be configured in the UI if that’s more your jam:
Powerpal to Home Assistant
⚠️ Update Jan 2024: The code used in this section has atrophied, since ESPHome did a big push around Bluetooth capability in 2023 and changed some signatures. The example below won’t compile on ESPHome since build ~2022.12. I have not put any effort into fixing this, as my local firmware remained stable for quite a while after, and I have subsequently stopped using Powerpal. (We installed solar in Apr 2023 and re-did all of the energy integrations then.) The concepts in this section remain valid, so you can always give it a go and update the code yourself.
The other part of the puzzle was to get Powerpal data flowing through to Home Assistant.
I mentioned earlier in the post that the Powerpal device only exposes data over Bluetooth LE, to one device, which is great for a simple consumer setup but is quite restrictive for what we wanted to achieve.
There’s an article on their support site stating that they’re working on an API, and they specifically name Home Assistant as a target platform. To do this, they’re exploring a Bluetooth LE to Wi-Fi bridge as a separate device. (There’s no way that the device itself could directly connect to Wi-Fi otherwise the battery life would drop from 3-5 years to 3-5 hours.) There’s a beta signup form, which I filled in maybe six months ago, but I have no sense of how fast they’re progressing this, so I’m not holding my breath waiting.
There’s also a big red block of text that says you should absolutely not attempt to tamper with the existing Bluetooth LE connectivity, citing “potential data security risks”.
Let’s do that. Red text always sounds exciting.
Considering it’s all local communication, I don’t really see how Powerpal can stop me here, and it’s all extremely low risk work as there’s no active control of anything.
Time to make our own Powerpal-compatible (but totally not tampering) Wi-Fi bridge!
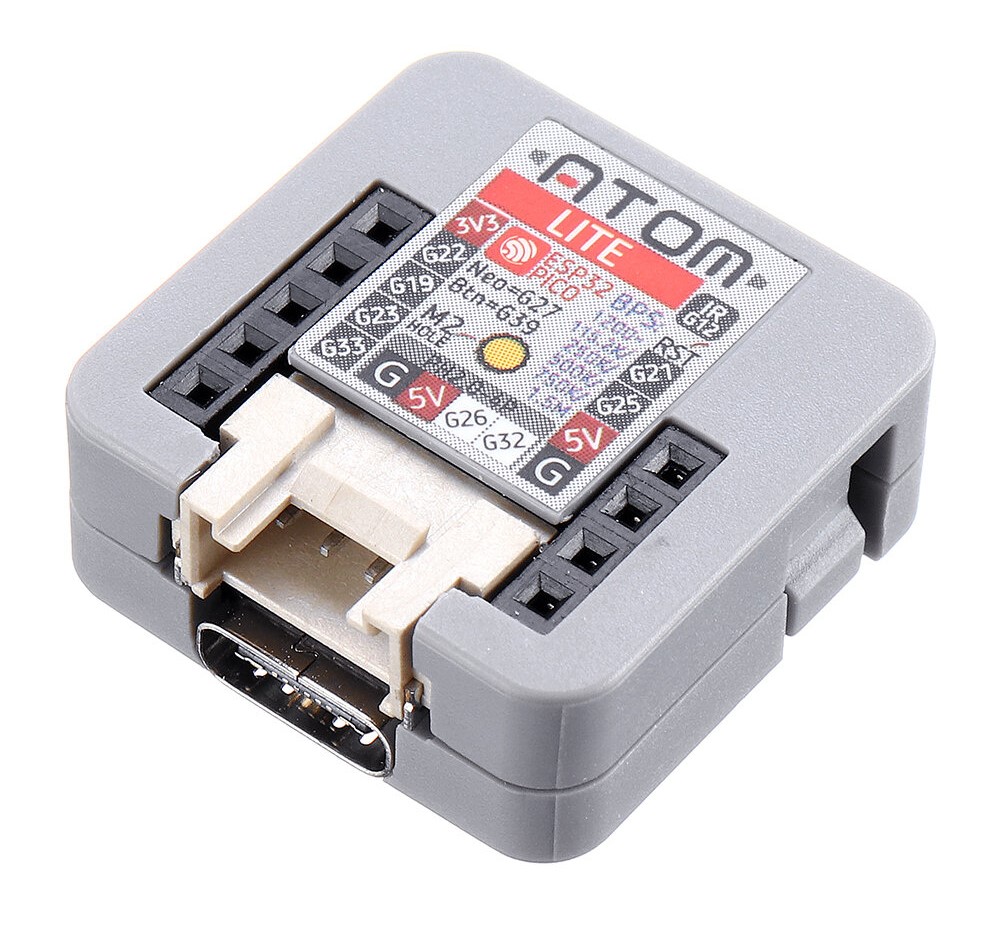
The device I’m using is an M5Stack Atom Lite. They’re US$7.50, tiny (24x24x10mm!), and USB-C powered. I’ve written about the versatility of them before. The chipset in them – an ESP32 – sports a 240MHz dual core processor, and a dual-stack Bluetooth + Wi-Fi radio, so it covers everything we need.
To make the firmware for it, I’m going to use ESPHome. This project is specifically focussed on making it really easy to generate firmware for ESP8266 or ESP32-based devices to talk to Home Assistant. You basically just give it a config file, and it does the rest. Getting going is as easy as installing the ESPHome Add-on in Home Assistant.
Thankfully, GitHub user @WeekendWarrior1 has already done the hard yards of reverse-working the Powerpal BLE protocol, and building a component for ESPHome.
In my local instance of ESPHome, I created a new device called powerpal_gateway. Then, in just 45 lines of config, we can describe everything we need to generate the gateway’s firmware. If you’re a beginner to this type of thing, you can just copy-paste this whole block into ESPHome.
We need to provide the Powerpal’s MAC address (physically printed on it), and the pairing code (supplied on a card when you get it). That’s all that’s required to authenticate. As a matter of practice, I split these secrets out into separate variables. There’s a “Secrets” button top-right in the ESPHome web interface to manage them.
For the first time loading firmware on to the M5Stack, we need to plug it into a laptop. Then, in ESPHome, we can choose the device > Install > Plug into this computer. ESPHome will take care of pulling in all of the dependencies, compiling them into a firmware binary, and then helping us flash them onto the device right from the browser (using Web Serial).
We also need to make sure our phone is disconnected from the Powerpal, otherwise our new gateway won’t be able to connect, so it’s a good idea at this step to either turn Bluetooth off on the phone, or just go ahead and uninstall the Powerpal app entirely.
After that first flash, the device can be disconnected from the laptop, and just plugged into any regular USB power brick. Future firmware updates can be done wirelessly / over-the-air. At this point, I moved the new gateway to its permanent home in an out-of-sight location near the front hall, so it had good proximity to the meter box.
Once the new gateway has a minute or so to power up and negotiate with everything, we start seeing data feeding into Home Assistant. Success!

Now that the sensors are available, we can add them to Home Assistant’s energy dashboard via Home Assistant > Settings > Dashboards > Energy > Electricity Grid > Add Consumption. You’ll need to wait until the hour turns over (e.g., 10:00, 11:00, etc.) before the first batch of statistics gets calculated and everything really shows up.
The “Total Energy” measure resets to zero each time the M5Stack boots up. This is mostly fine, as it should be a very rare event anyway, and Home Assistant’s statistics platform knows how to handle it, as the sensor is defined as a ‘monotonically increasing total’. If you need to unplug the device to move it or something, then the lowest data loss path is to do it across the end of the hour (e.g., unplug it at 10:58 and have it powered back up by 11:02).
We also added the real-time power usage, today’s energy, and yesterday’s energy, to the main dashboard. (Create a Utility Meter helper to get the daily sensors. It’s ~10 clicks.) That replaces the Powerpal app for us, and brings energy into our single pane of glass experience:

Summary
Just these few data points were a huge step for us to understand and optimise our electricity usage.
Considering the Powerpal was free, the only cost to integrate the grid energy data was the US$7.50 M5Stack. The Aeotec smart plugs were a bit more expensive (~AU$50 each), and we already had the Home Assistant instance running.
We now have environmental (temperature, humidity) and energy data into the same platform, so we can do smart automations and analysis in the one place.
We’re building longitudinal data. (Home Assistant feeds out to InfluxDB if you want as well.)
We’re able to monitor this from multiple devices, anywhere, anytime, thanks to Home Assistant acting as the broker, and Home Assistant Cloud for remote access. This is a marked improvement on the one-device-within-10m starting position of the Powerpal.
We’ve still got a lot further that we want to go. We’re installing solar next. I’m looking at the Schneider PowerTag range for circuit-level monitoring of the air conditioning. I’d like to bring in an intra-day view of our gas consumption.
And, like all smart home projects, it has just been nerdy fun to get this far. 🤓 None of this had to be done, but it could be done, so we did.
Jan 2024 Addendum
We installed solar in April 2023, powered by Enphase micro-inverters. This system provides data around solar production, house consumption, and grid import/export, based on a set of CT clamps connected to the Enphase Envoy controller. This data is then exposed over a nice, local-network API, on a 10sec refresh rate. We now use this data to power the energy dashboards in Home Assistant instead and have decommissioned our dependency on Powerpal. The best Wi-Fi setup for infrastructure is an Ethernet cable; I ran one to where the Enphase Envoy controller was being installed and never gave the installers any Wi-Fi details. Reliable, wired data, over a documented local API: win.
We also bought a farm last year and were back at the start line for energy monitoring on the property. A fresh HA instance, and a blank canvas for integration! We’ve deployed a Shelly Pro 3EM into the main board. This is a DIN-mount energy monitor, with three CT clamps, and a local-network API, on a 1sec refresh rate. The CT clamps are then clipped around existing AC circuits. The property only has single-phase, but we use the three CT clamps to measure: a) grid import/export, b) solar generation, and c) house usage (a separate circuit, which is a subset of the broader property). Again, the best Wi-Fi setup for infrastructure is an Ethernet cable, which the Shelly Pro 3EM supports. Reliable, wired data, over a documented local API: win. The only downsides to this device are cost (AU$200), and the need for a qualified sparky to install it.
Home Assistant has in-box / native support for both of these devices. As soon as they show up on your network, HA will auto-detect them and offer to bring them in.

You must be logged in to post a comment.